



Busiest Ports in the World: Top 10 by Container Volume
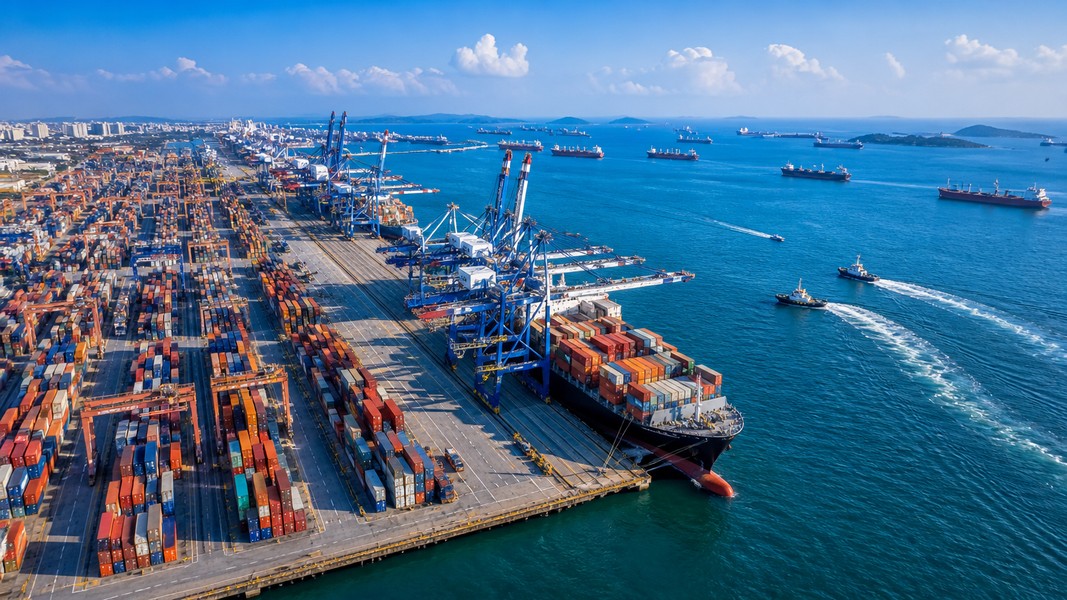
The busiest ports in the world, measured by containers handled, are led by Shanghai, which moved 55.06 million TEU in 2025 and stayed number one for a 16th straight year. Singapore came second with 44.66 million TEU and Ningbo-Zhoushan third with about 43.9 million. Six of the top ten sit in China, and every one of the top ten is in Asia or the Middle East.
If you follow cargo, watch ships or simply wonder where your goods pass through, these numbers explain a lot. They show where the world's trade actually concentrates, why a delay in one Asian hub ripples across every ocean, and why Europe and the US look small next to the leaders. Below you'll find the full 2025 ranking, how it is measured, what makes each port big, and what 2026 is doing to the picture.
Key Findings at a Glance
- Shanghai handled 55.06 million TEU in 2025, the first port ever to pass 50 million in a single year, a mark it crossed in 2024.
- The top 100 container ports together moved 792.2 million TEU in 2025, up 6.3% on the year, according to Lloyd's List.
- Asia accounts for almost 68% of all throughput in that top 100, and Chinese ports alone handle more than 40%.
- Ningbo-Zhoushan is the busiest port on Earth by total cargo weight, with 1.4 billion tonnes in 2025.
- Los Angeles is the busiest container port in the Americas at 10.2 million TEU, and Rotterdam leads Europe at 14.2 million TEU.
The Busiest Ports in the World by Container Volume
This ranking uses full calendar year 2025 throughput, counting loaded and empty boxes and both gateway and transshipment moves. Figures come from each port's own disclosures as compiled by TimeToCargo, with the order matching the 2026 edition of the Lloyd's List One Hundred Ports.
| Rank | Port | Country | 2025 throughput (TEU) |
|---|---|---|---|
| 1 | Shanghai | China | 55.06 million |
| 2 | Singapore | Singapore | 44.66 million |
| 3 | Ningbo-Zhoushan | China | 43.87 million |
| 4 | Shenzhen | China | 35.41 million |
| 5 | Qingdao | China | 34.20 million |
| 6 | Guangzhou | China | 28.05 million |
| 7 | Busan | South Korea | 24.88 million |
| 8 | Tianjin | China | 24.03 million |
| 9 | Jebel Ali (Dubai) | UAE | about 15.6 million |
| 10 | Port Klang | Malaysia | about 15.1 million |
The top ten is unchanged from the previous year. Just below them, Lloyd's List places Port of Johor in Malaysia 11th, Rotterdam 12th, Antwerp-Bruges 13th and Hong Kong 14th, followed by Xiamen, Tanger Med in Morocco, Laem Chabang in Thailand and Los Angeles at 18th.
How Port Rankings Are Measured
Most "busiest port" lists count containers in TEU, the twenty-foot equivalent unit. One standard 20 ft box is 1 TEU and a 40 ft box is 2 TEU, so the figure tracks how much boxed cargo crosses the quay. It counts every lift, which means a container unloaded from one ship and loaded onto another is counted twice.
That double count matters. A port that mainly moves boxes between ships can rank far higher than the size of its home market suggests. Singapore and Port Klang are the clearest examples.
Two other yardsticks give different winners. Cargo tonnage weighs everything a port handles, including oil, iron ore, coal and grain, which favours ports with big bulk terminals. Vessel arrivals in gross tonnage measure how much ship capacity calls at the port, which rewards hubs where large ships stop briefly. When two lists disagree about the busiest port, they are almost always using different measures.
Shanghai: The First Port Past 50 Million TEU
Shanghai has been the busiest container port in the world since 2010 and pulled further ahead in 2025. It handled 51.5 million TEU in 2024, the year it became the first port to pass 50 million, then grew to 55.06 million TEU in 2025.
To put that in context, the logistics analysts at Upply point out that Shanghai on its own now handles more containers than the top ten ports of the United States combined. Its growth held up even through the renewed US tariff war.
The port sits at the mouth of the Yangtze, the river that links China's coast with its industrial interior. That position makes it the natural gateway for a huge share of Chinese exports to Europe, North America and the rest of Asia.
Singapore: The Transshipment Giant
Singapore is the odd one out at the top. It has a small domestic market, yet it moved 44.66 million TEU in 2025, a record and an 8.6% rise on 2024, according to Singapore's port authority. Vessel arrivals also hit a record 3.22 billion gross tonnage, up 3.5%.
The explanation is transshipment. Most boxes landing in Singapore are not headed for Singapore at all. They come off one ship and leave on another, bound for Indonesia, India, Australia or Europe. The port sits on the Strait of Malacca, the main sea lane between the Indian Ocean and the Pacific, which makes it the natural place to switch ships.
On some measures Singapore is the leader rather than the runner-up. DNV and Menon's first Leading Container Ports of the World report named it the world's leading container port.
Ningbo-Zhoushan: Busiest by Cargo Tonnage
If you rank by weight instead of boxes, the answer changes. Ningbo-Zhoushan handled 1.4 billion tonnes of cargo in 2025, the 17th year in a row it has led the world on total cargo, as the port group reported in its 2025 results.
Its container business is catching up fast too. Throughput passed 40 million TEU for the first time and topped 43 million, a second straight year of double-digit growth. The port describes itself as the fastest-growing and largest-increment port among the world's top five over the past decade.
Ningbo-Zhoushan sits about 200 km south of Shanghai, so the two together form the largest concentration of port capacity on the planet.
Shenzhen, Qingdao and Guangzhou
Places four to six all belong to China as well, and each serves a different part of the country.
Shenzhen handled 35.41 million TEU in 2025. It is the main export gateway for South China and the manufacturing belt of the Pearl River Delta.
Qingdao moved 34.20 million TEU. It is the leading gateway for North China and is building out automated terminals quickly.
Guangzhou, a short distance up the Pearl River from Shenzhen, handled 28.05 million TEU. Its neighbour Hong Kong tells the opposite story: once a top three port, it recorded a fourth consecutive year of decline in 2025 and fell below 13 million TEU.
Busan, Tianjin, Jebel Ali and Port Klang
Busan in South Korea handled 24.88 million TEU in 2025, which makes it the busiest port outside China and Singapore.
Tianjin, the port for Beijing and northern China, moved 24.03 million TEU and rounds out the Chinese contingent in the top ten.
Jebel Ali in Dubai handled about 15.6 million TEU and is the largest port in the Middle East. It was among the weakest growers in the top ten in 2025, held back by the renewed conflict in the region.
Port Klang in Malaysia closes the list at about 15.1 million TEU. It works the Strait of Malacca alongside Singapore and its Malaysian neighbour Port of Johor, which sits 11th.
Why Asia Dominates the Busiest Ports in the World
The pattern in the table is not an accident. China holds four of the top five places, six of the top ten and nine of the top twenty, according to Upply's 2025 ranking. Together, the top 20 ports handled close to 450 million TEU in 2025, growth of around 5 to 6%.
Two forces push volume toward Asia. Manufacturing is concentrated there, so the export boxes start there. And the main east to west trade lanes all run through a handful of chokepoints, the Strait of Malacca above all, which turns ports like Singapore and Port Klang into compulsory stops.
The result is that a disruption in one Asian hub reaches the whole network within weeks. If you track a shipment from Asia, the port it leaves from matters as much as the ship it rides on.
Busiest Ports in the US
The busiest port in the US is Los Angeles. It handled 10.2 million TEU in 2025, its third best year ever and only slightly below 2024, and it has been the busiest container port in the Western Hemisphere for 26 consecutive years, according to the port's own statistics.
Its next door neighbour, Long Beach, forms the San Pedro Bay complex with it. Together the two ports handled about 31% of all containerized international waterborne trade entering and leaving the US. Across all US seaports, international trade in containers came to 39.8 million loaded TEU in 2025.
On the East Coast, the Port of New York and New Jersey handled 8.9 million TEU in 2025.
US ports grew less than most in 2025. Upply notes that the top ten US ports slowed sharply after a strong 2024, with Los Angeles and Long Beach among the weakest growers in the global top ten and Seattle and Tacoma down 5.5%. Importers pulled cargo forward early in the year to get ahead of tariffs, then slowed their orders.
Busiest Ports in Europe
Rotterdam is the busiest port in Europe. Its container volume grew 3.1% to 14.2 million TEU in 2025, while total throughput across all cargo fell 1.7% to 428.4 million tonnes, according to its annual throughput report. Container growth came from a 9.3% increase in imports from Asia.
Antwerp-Bruges in Belgium is Europe's second container port and sits 13th worldwide. The ten largest European ports handled 67 million TEU combined in 2025, up 3.1%.
The fastest climber was Gioia Tauro in southern Italy, which grew 14%, passed 4 million TEU and moved from 8th to 6th in Europe.
What 2026 Is Doing to Port Traffic
The 2025 ranking describes a year that is already gone, and 2026 has been rougher. The closure of the Strait of Hormuz during the conflict in Iran pushed up bunker fuel prices, stranded ships in the Gulf and sent Middle East freight rates higher. Port congestion then spread across South and Southeast Asian hubs, and by mid-year it was focused on Shanghai.
Volumes have held up regardless. Los Angeles processed more than 2.9 million TEU across June, July and August 2026, the busiest three months in its history. Rotterdam handled 7.021 million TEU in the first half of 2026, almost exactly level with a year earlier, and New York and New Jersey moved 4.43 million TEU over the same six months.
The next shift is a return to Suez. As carriers route ships back through the Red Sea, the shipping association BIMCO expects container capacity could end up 10% above demand. Shorter voyages through Suez could change which Mediterranean and Middle East hubs see the most calls, so expect some movement below the top ten in next year's ranking.
How to See What Is Happening at a Busy Port
Numbers on a table tell you how much moves through a port in a year. They don't tell you what is happening there today: which ships are anchored waiting for a berth, which are working cargo and which are about to sail.
AIS tracking fills that gap. Every large commercial ship broadcasts its position, speed and status, so you can open a live map over Shanghai, Singapore or Rotterdam and see the queue for yourself. Primo Nautic lets you search any of those ships by name, MMSI or IMO number and follow it into or out of port.
If you are waiting on a specific container ship, the more useful question is when it will actually arrive. Primo Nautic shows the captain's reported ETA next to its own calculated arrival time and flags a delay when the two drift apart, which is often the first sign that a congested port is holding ships at anchor. For cargo you can choose a shipment-focused view, and the updates stay factual and logistics-oriented.
Conclusion
Shanghai remains the busiest port in the world by a wide margin, with 55.06 million TEU in 2025 and growth that keeps widening its lead. Singapore and Ningbo-Zhoushan follow, each a leader on a different measure: Singapore in transshipment and vessel calls, Ningbo-Zhoushan in total cargo weight.
The top ten belong entirely to Asia and the Middle East, with China alone holding six places. Rotterdam leads Europe at 14.2 million TEU and Los Angeles leads the Americas at 10.2 million, both well below the Asian giants.
Which port is "busiest" depends on what you count, so check whether a list uses TEU, tonnage or ship arrivals before comparing. And with Hormuz, congestion in Asia and a return to Suez all reshaping traffic in 2026, the order below the top five is the part most likely to move next year.
Most Recent Posts
Discover more articles from our blog.