



Port Congestion: Why Ships Wait and How to Plan
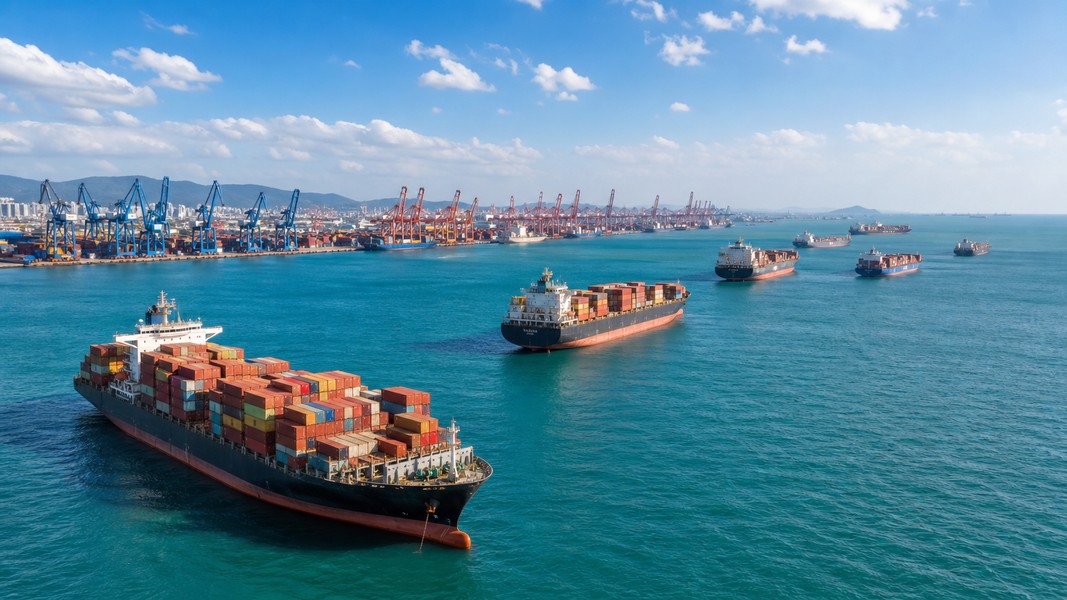
Port congestion happens when more ships arrive at a port than its berths and cranes can handle, so vessels sit at anchor waiting for a slot instead of working cargo. Nothing is broken on the ship. The box you are waiting on is a few miles from the quay and completely stuck.
That gap between "arrived" and "unloaded" is where most shipping frustration lives. Your carrier tracking page says the vessel reached the port days ago, your customer is asking where the goods are, and no one will give you a straight date. Understanding what puts a ship in that queue, and what you can actually control, turns an invisible delay into something you can plan around.
What Port Congestion Means in Practice
A port call has two distinct phases. First the ship waits for a berth, at anchor or drifting offshore. Then it goes alongside and the terminal works the cargo. Congestion is the first phase growing while the second one stays roughly the same.
That distinction matters because the waiting half is the part nobody schedules. Terminal handling time is reasonably predictable. Berth waiting is a queue, and queues behave badly once demand gets close to capacity.
The phrase also covers landside pressure. When containers pile up in the yard because trucks and trains cannot clear them fast enough, the terminal slows down, and that slowdown pushes back out to the ships waiting their turn.
The Numbers Behind the Delays
This is not a feeling. Global port congestion is tying up close to 4 million TEU of container capacity, according to reporting from Container News on DHL Global Forwarding's ocean freight update, as strong demand, weather disruption and a long transpacific peak season squeeze effective capacity.
Ships are also slower in port than they used to be. Drewry's analysis found that global average ship waiting times have nearly doubled between the first seven months of 2019 and the same period this year, and that the average time a containership spends in a port has risen 31 percent over that span. A larger share of that time is spent waiting rather than being worked.
The knock-on effect shows up in arrival dates. Sea-Intelligence data put global schedule reliability at 56.4 percent in July, a drop of 6.1 percentage points in a single month and the sharpest monthly fall since January 2021. When a ship did arrive late, it arrived an average of 6.06 days late.
Read that reliability figure again. Slightly more than half of sailings hit their published date, and the ones that miss, miss by most of a week.
Root Cause One: Peaks, Not Empty Berths
The obvious explanation is that ports are too small. The evidence is more awkward than that.
Drewry rejected the idea that a broad shortage of port capacity is the main driver, pointing instead to very high asset utilisation, operational disruption, and carrier practices that create sharp peaks in terminal demand. A terminal that copes fine with a steady flow of ships falls over when four large vessels show up in the same 24 hours.
Carriers see it differently. Maersk chief executive Vincent Clerc argued in an August financial presentation that roughly 15 years of lagging investment in terminal capacity since the financial crisis is catching up with trade growth, naming Europe, the east coast of South America, West Africa and the Middle East.
Both can be true at once. Thin spare capacity is what turns a normal peak into a queue, and bigger ships concentrate more boxes into fewer, larger arrivals.
Root Cause Two: Weather That Stops a Region
Weather does not delay one ship. It delays every ship in a sea area, then releases them all at the same time.
Drewry recorded typhoons in China pushing average berth waiting times to 3.6 days in early August. The storm itself passes in a day or two. The backlog it creates takes far longer to clear, because the ships that sheltered all arrive together and compete for the same berths.
This is why a delay can appear in your shipment weeks after the weather event, and thousands of miles from it. A vessel that lost three days in Asia carries that deficit across the ocean to its European or North American call.
Root Cause Three: The Hub Penalty
You might assume the biggest ports are the most reliable. They handle the most volume and have the most equipment, so they should absorb pressure best.
Sea-Intelligence found the opposite in North Europe. Its work on port-level reliability showed a clear hub penalty: Rotterdam, Antwerp and Hamburg, the three gateways handling most of the region's vessel calls, all recorded negative reliability deltas against the regional baseline.
The mechanism is transshipment. A hub is not just serving local cargo, it is also connecting services to each other, so a late arrival on one string ripples into the schedules of several others. Volume concentrates risk as well as cargo.
Root Cause Four: Single-Day Shocks
Labour action, system outages and equipment failures produce a different pattern: a sharp, dated event rather than a slow build.
Kuehne+Nagel's port operational updates from late August recorded Rotterdam running a seven-day average vessel waiting time of about 1.18 days with a strike confirmed for 4 September. A wait of roughly a day is manageable. A strike dropped into the middle of it is not.
The useful thing about this category is that it is often announced in advance. Unlike weather, you can usually see it coming if you are reading port advisories rather than only carrier tracking pages.
Why the Cost Lands After the Ship Docks
Here is the part that catches importers out. The expensive consequence of congestion usually is not the waiting itself. It is what happens to your free time once the box finally comes off.
Your free days for collecting the container typically start counting from discharge, not from the original scheduled arrival. So a ship that waited ten days at anchor discharges into a yard that is already full, at a moment when trucking capacity in the area is stretched by everyone else in the same situation. You get the same number of free days in worse conditions, and demurrage charges start accruing on a clock you had no way to influence.
Congestion converts a schedule problem into a cash problem, and it does it at the exact moment you have the least room to react. That is why watching the queue matters more than complaining about it.
How to See the Queue Before It Reaches You
Carrier tracking tells you a status. It rarely tells you a position, and almost never tells you how many other ships are ahead of yours.
Live AIS tracking closes that gap. If you follow the actual vessel rather than the booking, you can see whether it is under way, whether it has slowed down well before the port, and whether it is sitting at an anchorage. A ship that drops to near zero knots twenty miles off the coast is telling you something its carrier status page will not say for another two days.
This is what Primo Nautic is built for. You track the ship carrying your cargo by name, IMO or MMSI number, and get position, speed and navigation status in plain language rather than raw AIS fields, with an ETA calculated from the vessel's actual movement alongside the one the captain reported. When those two numbers separate, that gap is your early warning.
Speed is the signal most people miss. Carriers often slow a ship down deliberately when they know a berth is not free, because burning less fuel at sea is cheaper than idling at anchor. A vessel quietly dropping from 18 knots to 12 mid-ocean is congestion reaching you a week early.
Choosing a Carrier When Reliability Is the Variable
If arrival dates matter to your business, carrier choice is a lever you actually control, and the spread between carriers is wide.
In the July figures, Maersk led the top 13 carriers on schedule reliability at 73.7 percent and Hapag-Lloyd followed at 69.3 percent, while Wan Hai came in lowest at 29.8 percent. Not one of the 13 improved month on month, and MSC posted the steepest decline.
A gap of more than 40 percentage points between the best and worst performer is not noise. It is the difference between a schedule you can plan against and a date that functions as a rough suggestion. Comparing published sailings across carriers before booking, rather than defaulting to the cheapest rate, is worth the twenty minutes it takes to check sailings for any carrier.
Building Buffer Into the Dates You Promise
The last defence is arithmetic. If late ships arrive an average of six days late and only about half of sailings are on time, then a supply chain with no buffer is designed to fail roughly half the time.
Three adjustments do most of the work:
- Quote your customers from a realistic date, not the carrier's published one. If your lane has been running late, add the delay you have actually seen rather than the one you hope for.
- Book collection capacity provisionally and confirm it from the vessel's live position, not from the booking's ETA.
- Treat a heavily congested gateway as a routing decision. A secondary port with a longer inland leg can still beat a hub with a five day berth queue.
None of that removes congestion. It moves the cost of congestion from surprise charges to planned ones, which is a far cheaper place for it to sit.
A Plan for the Next Shipment
Start by identifying the actual vessel and its IMO number at the time of booking, not when the shipment goes quiet. Follow that ship from departure so you have a baseline for its normal speed on the lane.
Watch for two signals in transit: a sustained drop in speed, and a stop short of the port. Either one means you should be talking to your haulier about moving the collection window, while there is still capacity to move it into.
Then check the port itself before arrival week. Strikes, weather warnings and berth waiting averages are published by forwarders and port authorities, and a vessel tracking app such as Primo Nautic will show you how many ships are already sitting at the anchorage you are about to join. Counting the ships in the queue is a crude measure, and it is still better information than a status field that reads "in transit".
What the Queue Is Really Telling You
Port congestion is a capacity problem that shows up as a timing problem and gets paid for as a billing problem. Ships wait because terminals are running close to their limits, and anything that disturbs the rhythm, a typhoon, a strike, a bunched set of arrivals, turns a smooth flow into a queue.
The numbers for this year are clear enough: waiting times roughly double what they were in 2019, schedule reliability sitting in the mid-fifties, late ships arriving nearly a week behind, and close to 4 million TEU of capacity absorbed by the wait. That is the operating environment, not an unusual season.
What changes your outcome is visibility and buffer. Knowing where your ship actually is, reading its speed rather than its status label, choosing carriers whose reliability you have checked, and promising dates that account for a delay you can already measure. The queue will still be there. It just stops being a surprise.
Most Recent Posts
Discover more articles from our blog.