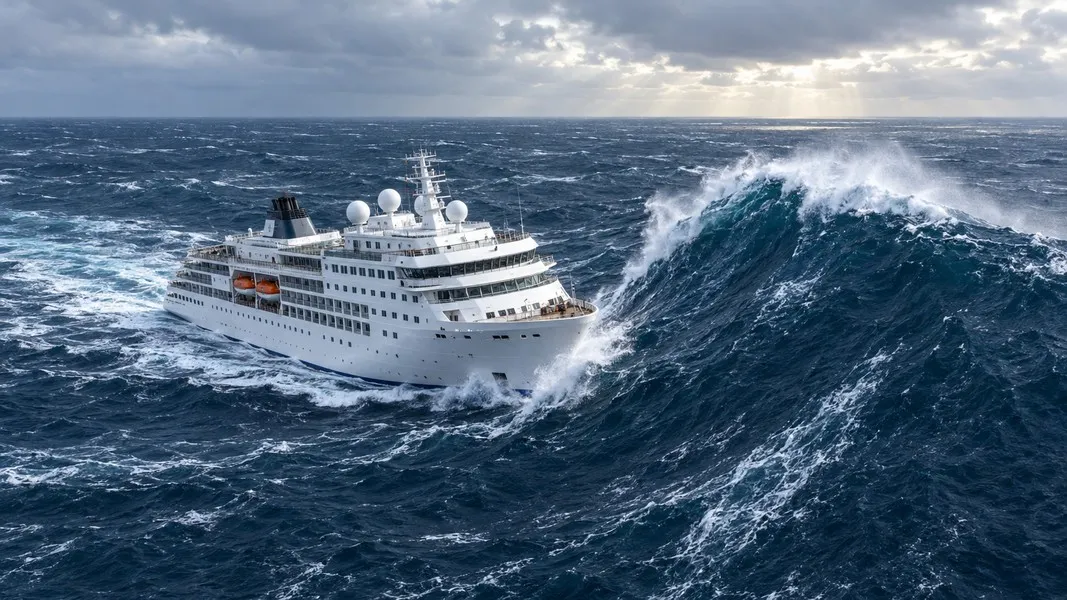
Rogue waves are ocean waves at least twice as high as the significant wave height around them, which is the average of the tallest third of the waves in that patch of sea. They appear suddenly, often from a different direction than the rest of the swell, and they can hit a ship that was handling the weather comfortably a minute earlier.
For centuries sailors described walls of water that came out of nowhere, and for most of that time scientists filed the stories under folklore. That changed on New Year's Day 1995, when an instrument on a North Sea gas platform measured one. Since then, researchers have counted rogue waves in billions of buoy readings, worked out most of what causes them, and started building forecasts.
This guide explains what rogue waves are, why they form, how often they happen, what they have done to real ships, and how ships are designed and steered to come through them.
What Is a Rogue Wave?
Every sea state has a mix of wave sizes. Oceanographers summarise it with one number, the significant wave height. According to Woods Hole Oceanographic Institution, that is the average of the tallest one-third of the waves in an area, and a wave only counts as rogue when it is at least twice that height. The most extreme rogue wave on record was about three times taller than its surroundings.
The definition is relative, not absolute. A 6-metre wave is ordinary in a North Atlantic winter gale and rogue in a sea whose significant wave height is 2.5 metres. Some researchers use a stricter threshold of 2.2 times the significant wave height, but every definition in the literature compares one wave against the sea it sits in.
The National Ocean Service describes rogue waves as greater than twice the size of surrounding waves and very unpredictable. They often arrive from a direction other than the prevailing wind, which is part of why they catch crews and passengers off guard.
The Draupner Wave: The First Rogue Wave Ever Measured
On 1 January 1995 at 15:00 UTC, a downward-looking laser on the Draupner gas platform, in the North Sea midway between Scotland and Norway, recorded a wave 25.6 metres from crest to trough. Its crest alone was 18.5 metres high. An ECMWF analysis puts the significant wave height in the area that afternoon at almost 12 metres, so the Draupner wave was more than double the sea around it.
That is roughly the height of a six to eight storey building. The platform itself backed up the reading: the wave loaded the underside of the deck, which ruled out an instrument error.
Draupner turned rogue waves from sailors' stories into measured fact. Since then other instruments have caught similar events, including the Andrea and Killard waves. On 17 November 2020, coastal waters off British Columbia produced a 17.6-metre wave in a sea where it stood 2.9 times the significant wave height. A 2023 paper in the journal Weather and Forecasting calls that likely the largest normalised wave height recorded anywhere.
What Causes Rogue Waves
There is no single cause. Three mechanisms have strong evidence behind them, and they can work together.
Waves stacking on top of each other
Ocean waves travel at different speeds and in slightly different directions. Most of the time their peaks and troughs fall out of step and roughly cancel. Now and then several crests line up at the same place and moment, and their heights add together into one much larger wave. Physicists call this linear superposition, or constructive interference.
Large studies now point to this stacking as the main pathway to everyday rogue waves. A 2021 study in Scientific Reports, which analysed more than a billion buoy measurements, found that linear superposition in seas with a narrow range of wave lengths does most of the work, with nonlinear effects adding only a minor correction. By far the most important factor it found was a property of the sea state called crest-trough correlation.
Waves stealing energy from each other
The older explanation, and still part of the picture, is nonlinear interaction. In some conditions waves do not simply add up; they exchange energy, and one wave grows at the expense of its neighbours. Physicists call this modulational instability. Buoy data shows that rogue waves also form often where this effect is weak or absent, so it explains fewer of them than once thought. The University of Victoria noted that the newer research breaks with the common view that rogue waves form when one wave slowly draws energy from another.
Currents that squeeze the waves
When waves run into a strong current flowing the other way, they shorten and steepen. The Agulhas Current off the east coast of South Africa is the best known example, and the European Space Agency calls it notoriously dangerous. ESA also links rogue waves to the Gulf Stream in the North Atlantic, where it meets waves coming down from the Labrador Sea.
Weather patterns play a role too. One study of the North Sea found rogue waves tended to appear when a deep low sat off northern Norway while a high pressure cell held over the Bay of Biscay.
How Often Rogue Waves Happen
For a long time nobody could say, because few instruments were in the right place. Two large datasets have since changed that.
The first came from space. In December 2000 the European Union launched a three-year project called MaxWave to confirm how common rogue waves are. Researchers processed around 30,000 radar images from ESA's ERS satellites covering just three weeks of ocean, and that census helped establish that rogue waves are widespread.
The second came from buoys. The Free Ocean Wave Dataset holds about 1.5 billion individual waves recorded by 158 buoys along the Pacific and Atlantic coasts of the United States, Hawaii and US territories. The researchers behind it identified roughly 100,000 rogue waves, or about one in every 15,000 waves.
What one in 15,000 means
That rate breaks down in a few useful ways:
- Rogue waves are routine at ocean scale. The University of Copenhagen team said the count is equivalent to around one monster wave every day at any random location in the ocean.
- They are rare for any one ship. One wave in 15,000 is rarer than the roughly one in 3,000 that simple wave theory predicts for a narrow sea, which means real seas produce them less often than the textbook model.
- They sometimes arrive in groups. About 3% of the rogue waves in the dataset came within 30 seconds of another one.
There is also a trend worth knowing. In 2019 a study reported by the BBC found that rogue waves are occurring less often but becoming more extreme, which raises the risk for shipping even as the count falls.
Rogue Waves and Ships: What Has Actually Happened
ESA has noted that severe weather sank more than 200 supertankers and container ships longer than 200 metres over two decades, and that rogue waves are believed to be the major cause in many of those losses. Most of those ships went down far from any instrument, so the evidence is often the damage itself.
Bremen and Caledonian Star, 2001
Within one week between February and March 2001, two hardened tourist cruise ships, the Bremen and the Caledonian Star, had their bridge windows smashed by 30-metre rogue waves in the South Atlantic. The Bremen was left drifting without navigation or propulsion for two hours. The satellite images MaxWave searched were taken from the weeks around those two strikes.
Viking Polaris, 2022
On 29 November 2022 the expedition cruise ship Viking Polaris was crossing the Drake Passage from Antarctica to Ushuaia when a wave struck her side south-east of Cape Horn. It shattered the windows of seven cabins. One passenger died and eight were injured.
Media called it a rogue wave. The official investigation report from the Norwegian Safety Investigation Authority describes it as a breaking wave, and found that the sea conditions were within the range the ship was designed for. The windows failed because the pressure of a breaking wave exceeded what they were built to take, and no class rules required them to withstand it. If you are reading about rough weather because someone you love is on a cruise, our guide to cruise ships in bad weather covers what normally happens on board.
How Ships Survive Rogue Waves
Ships come through most rogue wave encounters because of two things: how they are built and how they are steered.
Built to a design sea state
A ship like the Viking Polaris is designed against a wave scatter diagram, a statistical picture of the seas it is expected to meet. Classification society rules then set the loads that structures such as windows must take. The MaxWave project was set up partly to check whether those design criteria allowed for waves as big as the ones satellites were finding.
The Viking Polaris investigation showed where that system still has gaps. Window design pressure on the ship varied with height above the water, from 2.5 kPa on deck 6 to 24.4 kPa at the aft end of deck 2. The NSIA concluded that the rules of the International Association of Classification Societies, including DNV's, give values too low to withstand breaking waves against the side of a ship. It recommended that DNV push IACS to add breaking-wave requirements to all class rules.
Steered to meet the sea
The most effective tool on the bridge is still course and speed. The Viking Polaris weather restrictions told the crew to change course in unfavourable seas so the ship would sail at reduced speed with the bow heading into the waves. That keeps the seas off the long, exposed side of the hull, which is exactly where the Viking Polaris was hit.
The investigators found that the bridge team saw no particular reason to change course or speed that night, and that the crew lacked the means to predict the risk of a breaking wave reaching so high up the ship's side. They also warned that the ship and her sister, Viking Octantis, could face the same exposure in a beam sea with increasing wind, which is common in the Drake Passage for much of the year.
That is why the ship's heavy weather procedure was built around forecasts. A crew that knows the wind force and how the sea is building can turn into it early. Our explainer on the Beaufort wind scale shows how wind force maps to the sea a ship will meet.
Can Rogue Waves Be Predicted?
Not wave by wave, but the odds can now be forecast. In 2023 Dion Häfner, Johannes Gemmrich and Markus Jochum published a model in PNAS that a neural network learned from the buoy dataset and that was then reduced to a readable equation. It reproduces known wave behaviour, gives well-calibrated probabilities, and scores better on unseen data than existing theory.
A follow-up paper in 2024 tested an empirical version of that formula as a forecasting tool and found it skilful, with the formula fairly reliably predicted by the wave hindcast of the European Centre for Medium-Range Weather Forecasts. A separate 2023 study built a probabilistic rogue wave forecast for the northeast Pacific from the WAVEWATCH III model.
What these forecasts give is a risk level for a sea area, not a warning that a specific wave is coming. That is still useful. A route planner or a captain can treat a high-risk forecast the way they treat a gale warning: slow down, change heading, or wait.
Following a Ship Through Rough Seas
If you have a partner working on a cargo ship or a parent on a cruise, a storm in the news can be hard to sit through. Rogue waves cannot be tracked, but the ship and the weather around it can.
Primo Nautic shows a vessel's live position, speed and course from AIS data, along with the weather at the ship's exact location: temperature, wind speed, visibility and sea state information. A slower speed or a change of heading in heavy weather can be the crew doing exactly what the Viking Polaris procedures described, turning the bow into the sea.
For families, Primo Nautic turns that data into plain updates. The Loved One Working at Sea and Loved One on Cruise tracking purposes explain progress and conditions in a supportive tone, and arrival and delay alerts let you know when the ship is running late, so you are not left refreshing a map at 3 a.m.
Conclusion
Rogue waves are real, measured and better understood than ever. A wave counts as rogue when it is at least twice the significant wave height around it, and the Draupner wave of 1995 proved they exist. Most form when ordinary waves line up and add together, with energy exchange between waves and strong opposing currents adding to the risk in some seas.
They are routine across the whole ocean and rare for any single ship. In the best documented cruise ship cases, the damage fell on windows, and the Viking Polaris investigation showed that design rules still lag behind breaking waves. Ships survive through design margins, through crews who turn the bow into the sea and slow down, and increasingly through forecasts that flag which waters carry the highest risk.