


Analysis and forecasts
Analyses of Weather Data

Forecasting the weather starts with continually observing the state of the ocean, land surface and the atmosphere. The World Meteorological Organization lays down the framework for developing worldwide chain of observing systems, such as satellites, radars, sonars, and surface weather measurements that assist in monitoring these conditions. Observations and measurements collected from private citizens, especially of precipitation type and heavy weather, are progressively available through social media, various weather platforms, etc.
In recent years, scientists have made substantial progress in developing mathematical methods to integrate these measurements into snapshots of the land surface and atmospheric state at all times. Such analyses serve as a base for weather forecast on scales from separate clouds to regional heavy weather events and global patterns. The analytical data gathered from present and past weather support has various environmental applications, as well as vital scientific research on the climate system.
Forecast Techniques
Meteorologists build their forecasts based on data from satellites, airplanes, ships, weather stations and buoys, and devices dropped from airplanes or weather balloons.
Climatology Method
The climatology method is a relatively simple technique for generating a weather forecast. Forecasters use this method after analyzing weather statistics collected over numerous years and determining the averages. They forecast the weather for a particular day and location found on the weather circumstances for that same day several years in the past.
Analog Method
The analog method is a relatively difficult method to use when forecasting the weather since it requires identifying a day in the past that had similar weather to the present forecast, which is hard to do.
Persistence and Trends Method
The persistence and trends method calls for little to no skill to forecast the weather since it relies on past trends. In a perfect world, the atmosphere transitions slowly, which relates to a forecast tomorrow that remains the same as today, with reference to the climate's average for the specific time of year.
Numerical Weather Prediction
Numerical weather prediction depends on computers to predict the weather. Big supercomputers, together with software forecasting models, aid meteorologists in make weather predictions built upon different conditions in the atmosphere such as temperatures, rainfall, snowfall, wind speed, pressure, etc.
Analysis of weather maps
To be able to predict the future development of the weather, we have to analyze the existing (current) weather and link it with the previous (past) weather. That kind of analysis of weather is carried out "synoptically", so wider geographical area displays those elements and phenomena on which weather depends; for that purpose, special maps are used, called synoptic maps or weather maps.
Weather or synoptic map is a map of a particular geographic area on which, apart from the network of meridians and parallels, there is the entire network of synoptic stations. The position of each of these synoptic stations on the map is marked by a circle which we call the cellular circle. Around that cellular circle, by using symbols and numbers (according to scheme of cellular model), there are meteorological elements which we obtained from simultaneous measurements on synoptic stations in a specific geographical area. For the purposes of the port and the ships, weather maps come in small formats. These maps contain, in addition to data collected by the meteorological reports, additional data on the storm movements (thrombi, tornadoes, tropical cyclones, etc.). Most ships today use these maps for synoptic consultations by a specific key, FM 46 D IAC FLEET. Maps with entered data about cellular circles with the selected baric systems and some other meteorological phenomena that characterize that weather are called synoptic maps or weather maps.
Synoptic maps are divided into ground and height maps. The data of the surface synoptic observations relate to the ground maps and are of special importance for ships. Maps that contain the aerologic observations obtained from pilot-balloons, radio probes, satellites, aircrafts and rockets are called height maps. They are also called the maps of absolute topography because the sea level is below the height of the isobaric surface. Apart from them, maps that show the relative topography between the two high-altitude isobaric areas also exist. In addition to data about the height of the isobaric surface on height maps, we can find data on wind, dew point temperature and air temperature. Also, various aerologic diagrams are used, as well as vertical troposphere cut, alongside with many other aids.
For the making of the synoptic (i.e. weather) map, the appropriate codes are needed, i.e. the international keys in order to make these reports understandable regardless of the specific language and sailing area. Therefore, each meteorological element corresponds to a numeric code, and each of those codes to one symbol (a coded number or some graphic character) that, given the position of weather stations on the map, has a specific location. On board, in order to decrypt the report for the drawing of a map, the synoptic keys are FM 21 D SHIP (which is used for surface report from the ship in its full form) and FM 11. D SYNOP (used for surface report from the mainland).
International Analysis Code (IAC Fleet) for marine radio weather
If a seaman wants to closely follow the weather situation, he needs the report of the station which broadcasts only synoptic report of that particular area. There is an international key in which synoptic reports are composed. They are encrypted and called International Analysis Code (IAC). Coordinates of a series of points that determine the positions of fronts, isobars and other elements are entered onto the weather map and therefore display the general synoptic situation of specific area. Here, it is not necessary to enter the elements according to the cellular model, nor is it necessary to carry out the processing of the synoptic map according to these elements, since it provides us with an already processed weather map. Further work is mostly based on diagnosing whether and determining which baric systems affect weather in this sea area, the speed and direction of movement, the baric expression, whether some of the fronts affect the weather, air mass located in the area, its characteristics, the kind of precipitation and its intensity, general weather in a maritime sense, and steps to take to change the route and assure the ship's safety.
Air masses
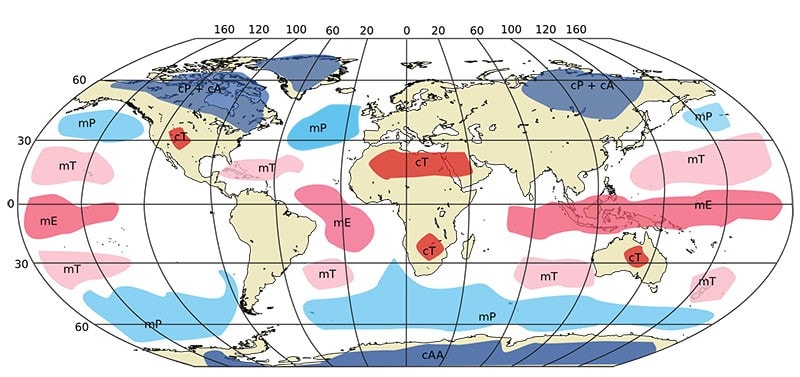
An air mass is the name for a large amount of air, whose physical properties (temperature and humidity) are almost uniform at all levels of altitude. Their dimensions vary from 500 to 5000 km and affect the surface up to few million km2. An air mass forms when the atmosphere stands in contact with a large, nearly uniform land or sea surface for a long enough time to acquire the temperature and moisture characteristics of that surface. A warm air mass is the one in which the temperature of the lower layers is greater than the temperature of the surface. In contrast, when it comes to cold air mass, the temperature of these layers is lower than the temperature of its surface. Cold air mass originates from the polar zone, or from cold continents, where it stands out with particularly stable balance, also with low humidity and with very low temperature.
Atmospheric fronts
Frontal seat belt is a transitional area between two air masses. It can be as long as 1000 km, and wide over 100 km in the direction of advancement. It can be spread through the entire atmosphere in height. Narrowing of the frontal belt, when the frontal belt passes into the frontal surface, is called the frontogenesis, and the spread is referred to as frontolyzes.
Frontal stripe, frontal line or front, is the projection of the lower part of the seat belt onto the Earth's surface. Fronts can be divided according to geographical area to: Arctic (in the southern hemisphere Antarctic), polar and tropical (Equatorial) front. According to the thermal criterion, fronts can be divided into: cold, warm and occluded front. According to altitude, they are divided into the ground and high front.
Warm fronts are formed when warm air masses catch up with colder air masses, come into contact with and suppress them. Warm fronts are mostly stable with layered overcast. If the warm air mass is unstable, then it can become unstably warm. In their prefrontal area convective overcast occurs, with precipitation followed by strengthened rainfall showers and thunder.
Cold fronts occur when cold air masses catch up with warm air masses, come into contact with and suppress them. They score under the warm air masses in a form of a wedge and gradually push them out. Slow moving or cold fronts of 1st type occur when cold air mass rises, scores under warmer air mass and displaces it. The speed of the front movement reaches, and rarely exceeds, a speed of 10 m/s. Fast moving cold front, or of 2nd type, occurs when the cold air mass rises rapidly, scores under the warmer air mass and displaces it abruptly. The speed of the front movement exceeds 10 m/s and sometimes reaches up to 30 m/s. Ahead of the front, from the very developed clouds (Cb), shower rain occurs, followed by thunder and strong wind. In the background, with the penetration of colder air, considerable convectional overcast can develop, accompanied by precipitation from cumulus (Cu) and cumulonimbus (Cb). This forms a secondary cold front.
Occluded front unites features of warm and cold fronts, and appears in the final stage of the development of the cyclone. Cold front, as a faster one, catches up with the warm front, and the hottest air mass is repressed upwards, while a front between the two cold air masses (one is colder) is created in the lower atmospheric layers. This binding of fronts starts with the center of the cyclone and expands to its edges.
Warm occlusion occurs if the cold air behind the front, which catches up with the previous warm front, is less cold (warmer) than the cold air ahead.
Cold occlusion occurs when the cold air behind the front, which catches up with the previous, is colder than cold air of the preceding front.
Stormy stripe (squall line) is an area of very strong instability and storm (thunder) that develop within a hot part (sector) of the cyclone. It is usually located 50 to 100 km, and sometimes even 200 km ahead of the cold front and is situated approximately in parallel. It occurs with the arrival of a quick cold front which in the hot part of the cyclone, where there is a very strong heating of the surface, urges lifting of unstable and moist air.
Stripe of rapprochement (convergence) indicates the air flow according to a line that causes the air lift. The type of overcast depends on humidity and intensity of the upward force.
Cyclone and anticyclone
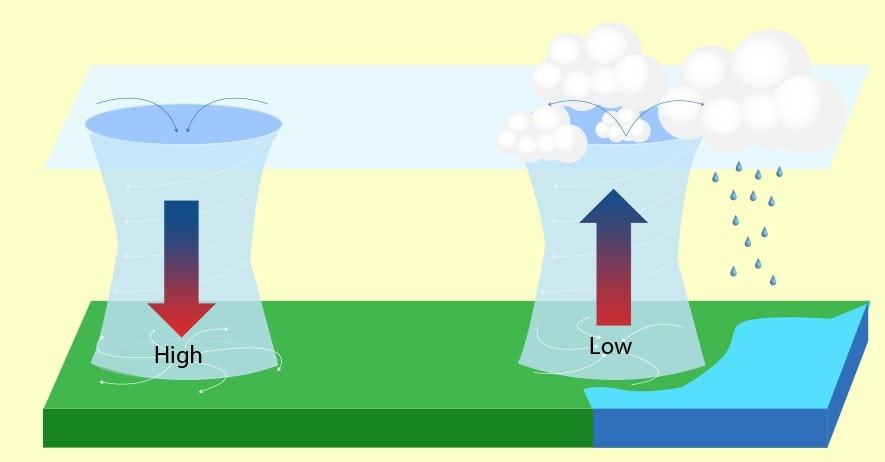
Cyclone is a low area of atmospheric pressure. It is a giant air whirlpool in which air in the northern hemisphere moves counterclockwise, and clockwise in the southern hemisphere. They travel from west to east and their dimensions can vary from a few hundred to a few thousand kilometers.
Anticyclone is an elevated area of atmospheric pressure. It is a giant air whirlpool in which air moves oppositely of that in a cyclone. In the northern hemisphere, it moves clockwise, and in the south counterclockwise. In the center of the anticyclone, there air lowering and its expansion towards the edges occurs. Their dimensions can vary from a few hundred to a few thousand kilometers.
Weather in an anticyclone is clear and warm in the summer, while in winter, depending on the amount of air humidity, it can be clear and very cold, i.e. foggy and less cold. Subtropical anticyclones are almost motionless and are located in subtropical regions (25 to 35°S and N), taking into account that its branches may affect even higher latitudes, up to 50 °. Temperatures are high; they are sources of trade winds. This includes the Azores anticyclone.
Stationary (fixed) or cold anticyclone are formed near the soil in a thin layer of very cold air. Such areas of high pressure are fixed and faintly moveable, while the maximum values of the pressure up to 1080 hPa. The Siberian anticyclone is a good example.
Mid-cyclone anticyclone occurs between the two cyclones of the same cyclone family and occurs in a cold air mass behind the cold front, so it has the features of cold anticyclone.
Final anticyclones, i.e. anticyclones in between the cyclone family can be related with the subtropical anticyclone.
Blocking anticyclone is a phenomenon that occurs when the separate anticyclone in moderate and higher latitudes develops to larger heights, so the floor cyclones, as less developed systems, move around it. This situation last for an average of 16 days, sometimes even for a month, and most often occurs in the area of the western coasts of Europe and North America.
Hazards
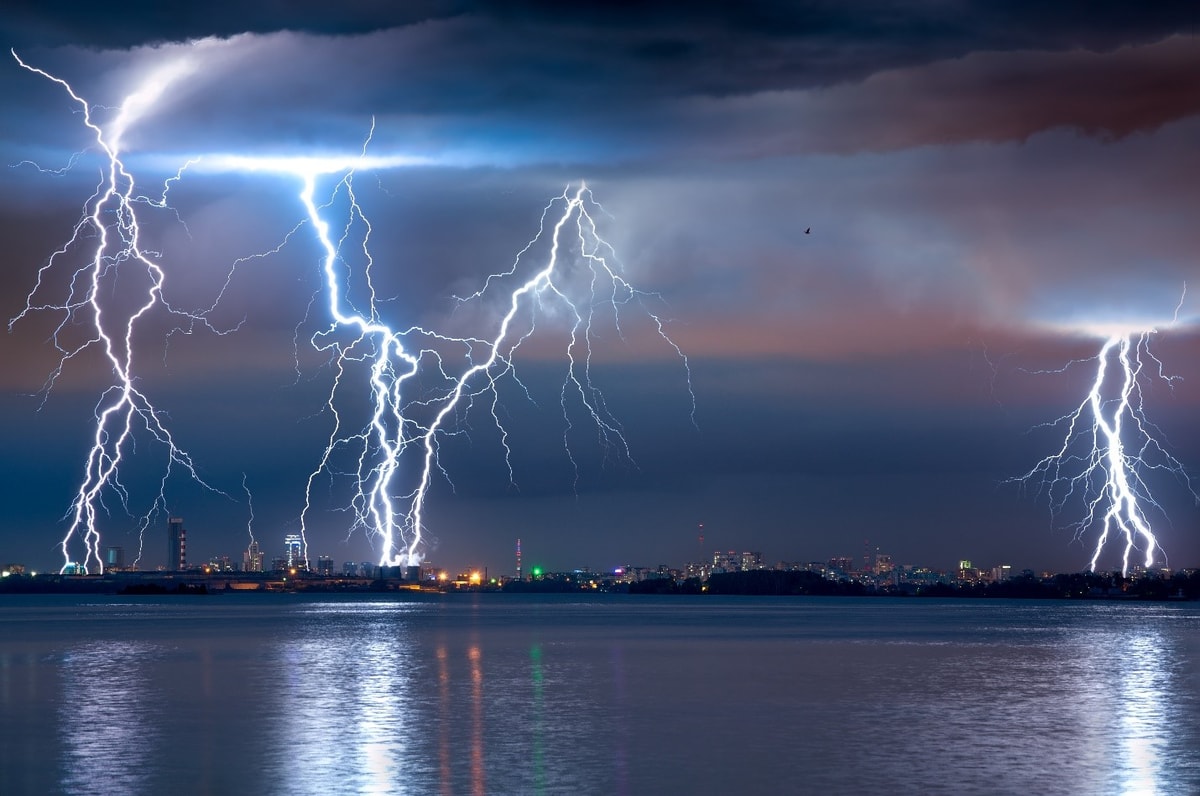
Storms - a storm implies lightning storm, accompanied by strong wind, expressed ascending and descending air currents, shower precipitation, especially hail, low visibility, electric discharges, turbulence, icing, sudden change of temperature and air pressure and other side effects. An integral part of the storm form convective clouds (Cumulus - Cu and Cumulonimbus - Cb) which develop with the air lifting, i.e. the more unstable air (hotter and wetter). Convection is stronger and it covers thicker layers of the atmosphere, if latitude is smaller. The development of convection is stronger in the warm seasons of the year, in hours of extreme temperature differences between the surface and the air. The development of convective clouds is the largest mainly in the later afternoon over land. Such instability is more common above the sea in the night hours, as a result of the cooling of the lower and middle layers of the troposphere, while the temperatures of the water surface are more or less unchangeable.
Cumulus in its development crosses all stages (humilis -> mediocris -> congestus) until it crosses into cumulonimbus. Cumulonimbus causes huge amounts of rain, ice and snow, and its top can get into the highest layers of the troposphere, and even break through to the stratosphere. Lightning is a diversified electrical spark whose diameter ranges from a few up to 50 cm, and its length is 2 to 3 km, up to 20 km. It occurs between isotherms, 0 and -8 ° C, and the most common area in which lightning occurs is located at altitudes between 300 and 6000 m. Electrical voltage of lightning amounts to about several million volts (50x103 to 40x106 V), and the electricity from 10 to 110 kA. Its duration is short-term, from 0.01 to 2 s. This means that the average lightning has the energy of 40 MWh.
Thunder is a sound phenomenon that follows lightning. It occurs after the rapid expansion and contraction of the air due to its very strong warming (25 000 K). Tornado is an air whirlpool, similar to a large, strong wind, and usually occurs over land. Its diameter is 100 meters, maybe over a mile; it achieves the height of the strong wind. Circumferential wind speed is 50 to 150 m/s, while the speed of moving 15, even up to 25 m/s, and the lanes are usually few kilometers long, sometimes even a few hundred km. It lasts from a few minutes to a few hours.